Public beta now live
See every trade, every delta, every price level.
The footprint chart platform for serious traders. Real-time orderflow data, right in your browser.
Six Pillars of Orderflow Mastery
Every feature built for traders who demand precision.
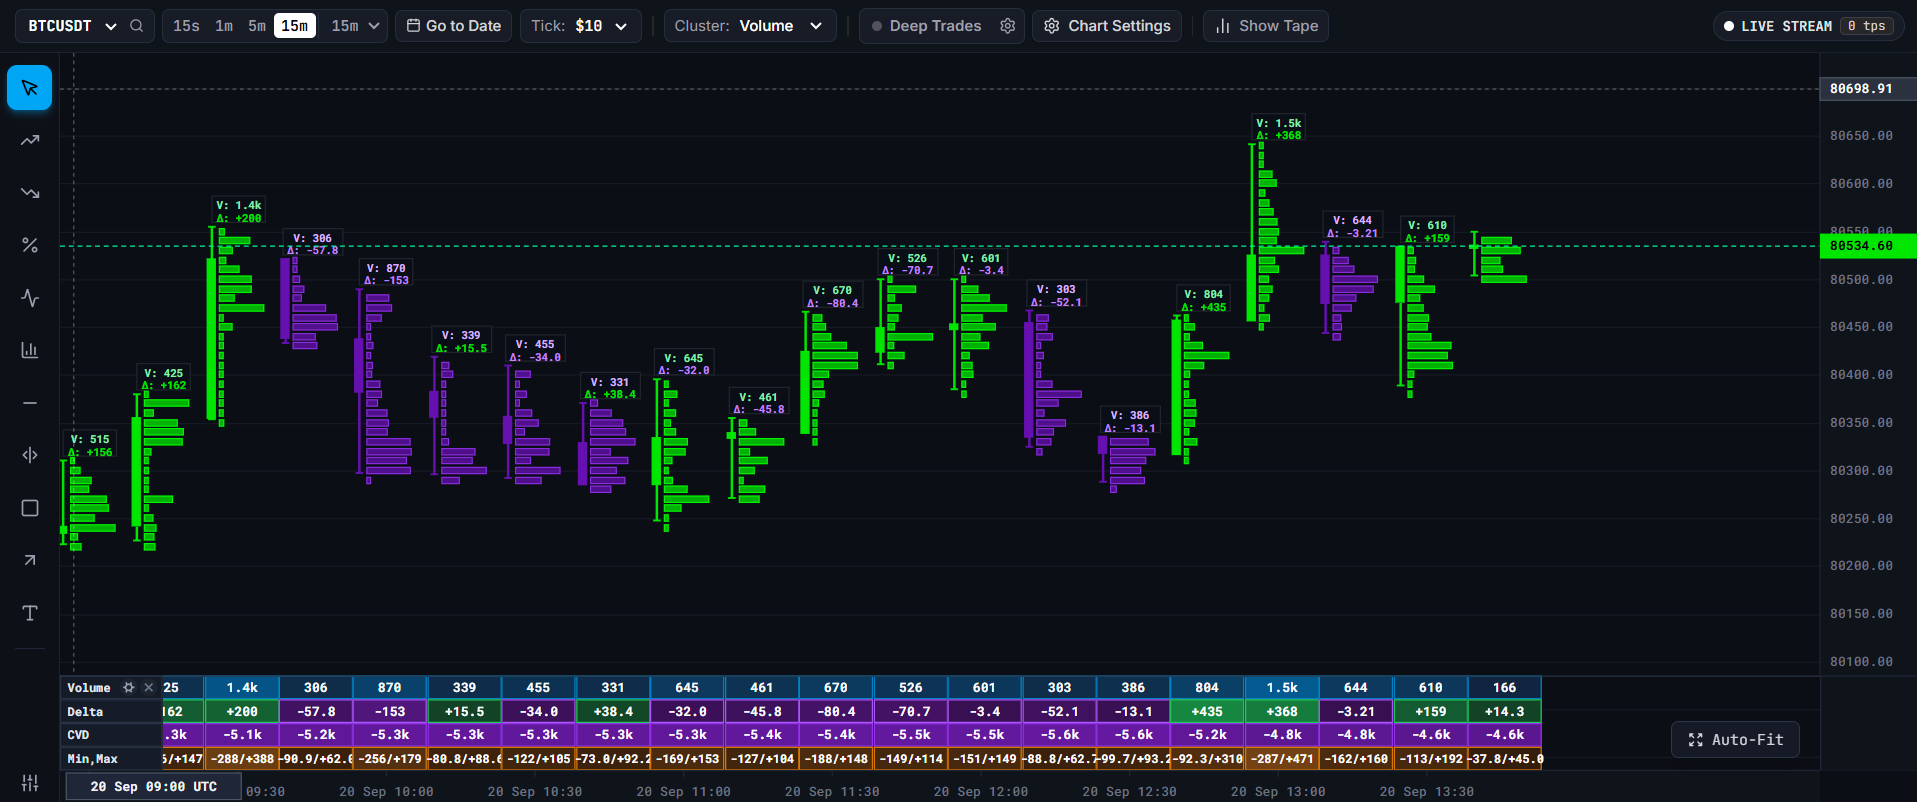
Footprint Bar Stats
Delta-annotated footprint candles showing bid/ask volume at every price. Full transparency on every bar.
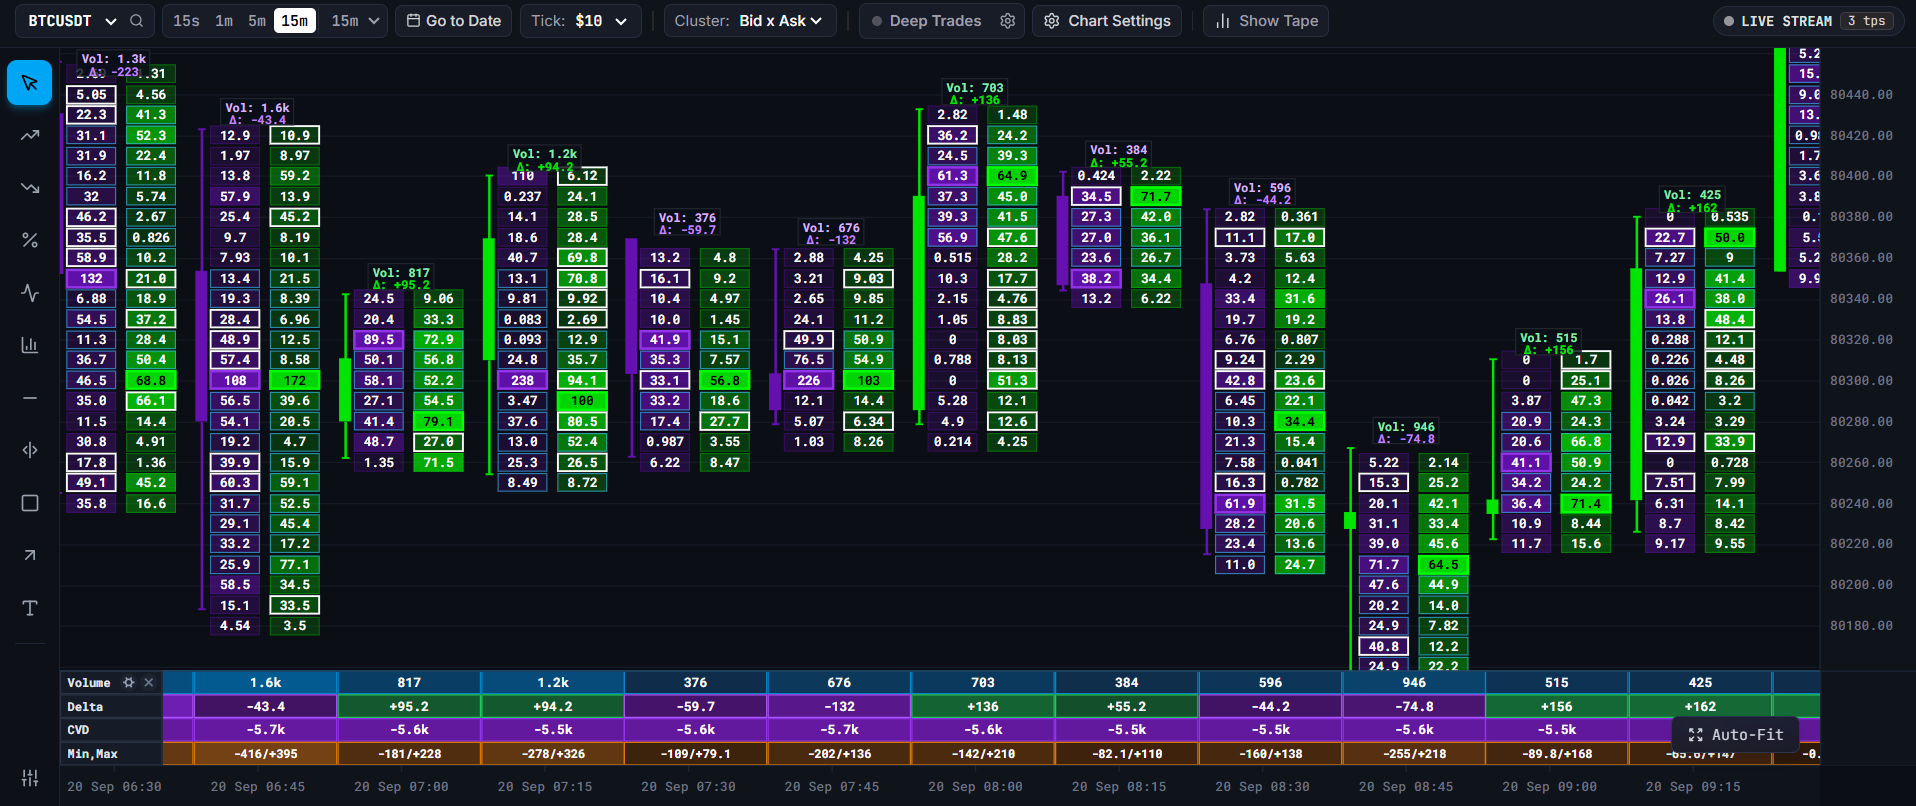
Bid Ask
Real-time bid/ask imbalance visualization. See where buy and sell pressure meets at every price level.
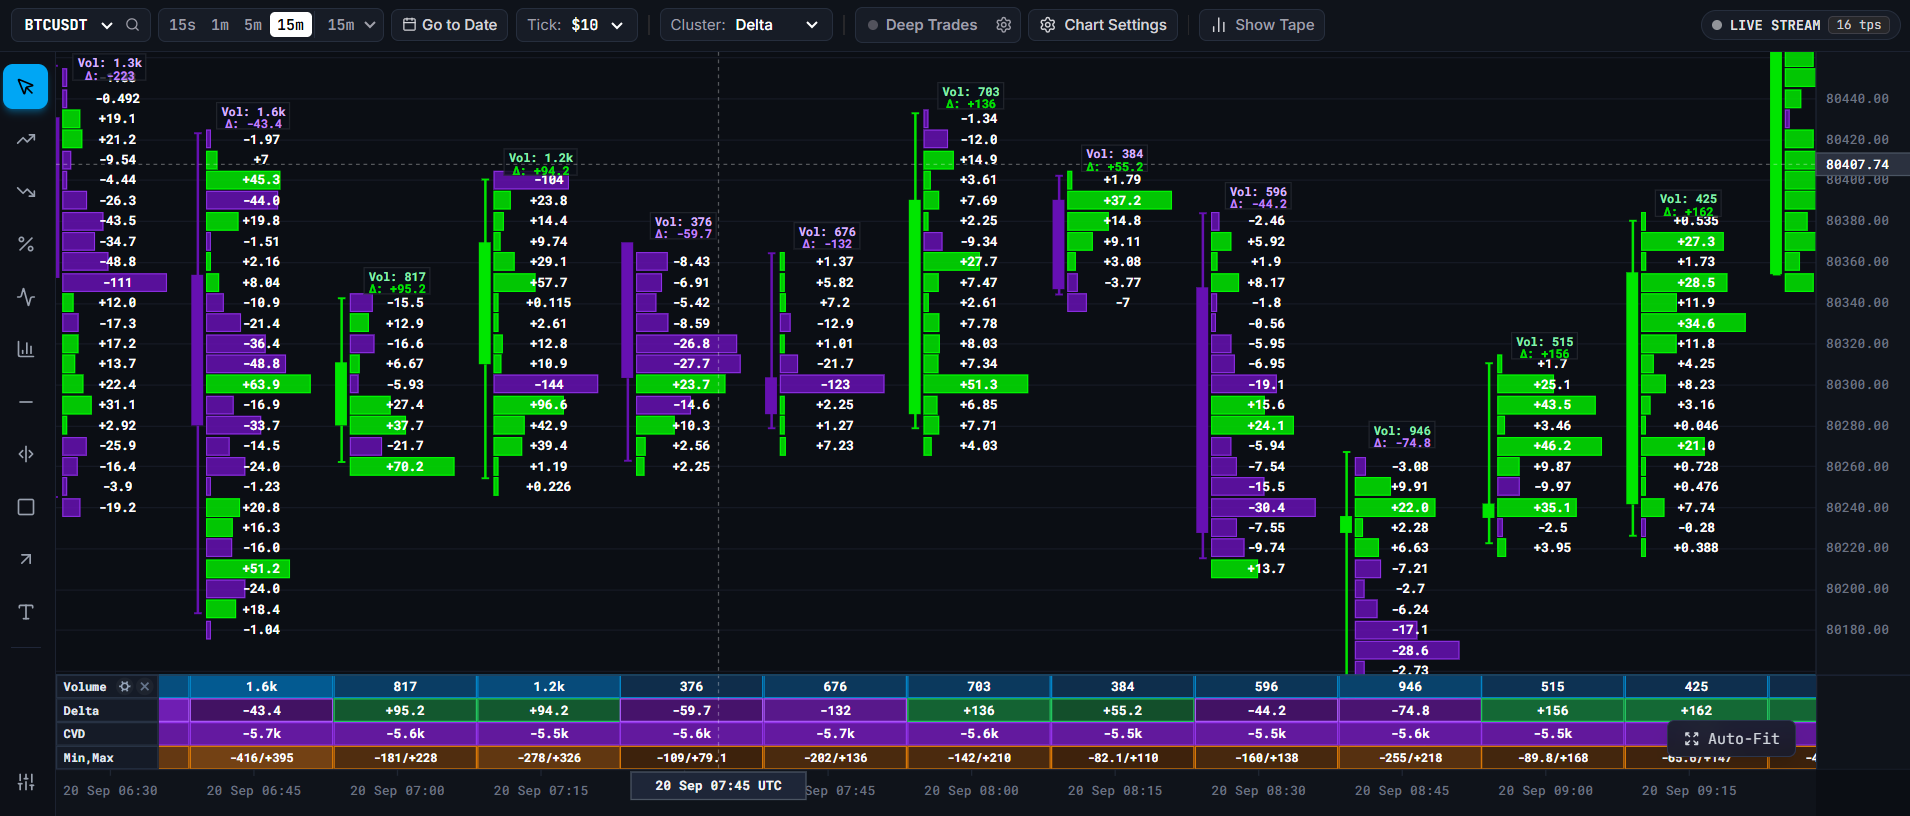
Delta Profile
Aggregated buying/selling pressure across the entire trading session. Know who's in control at every moment.
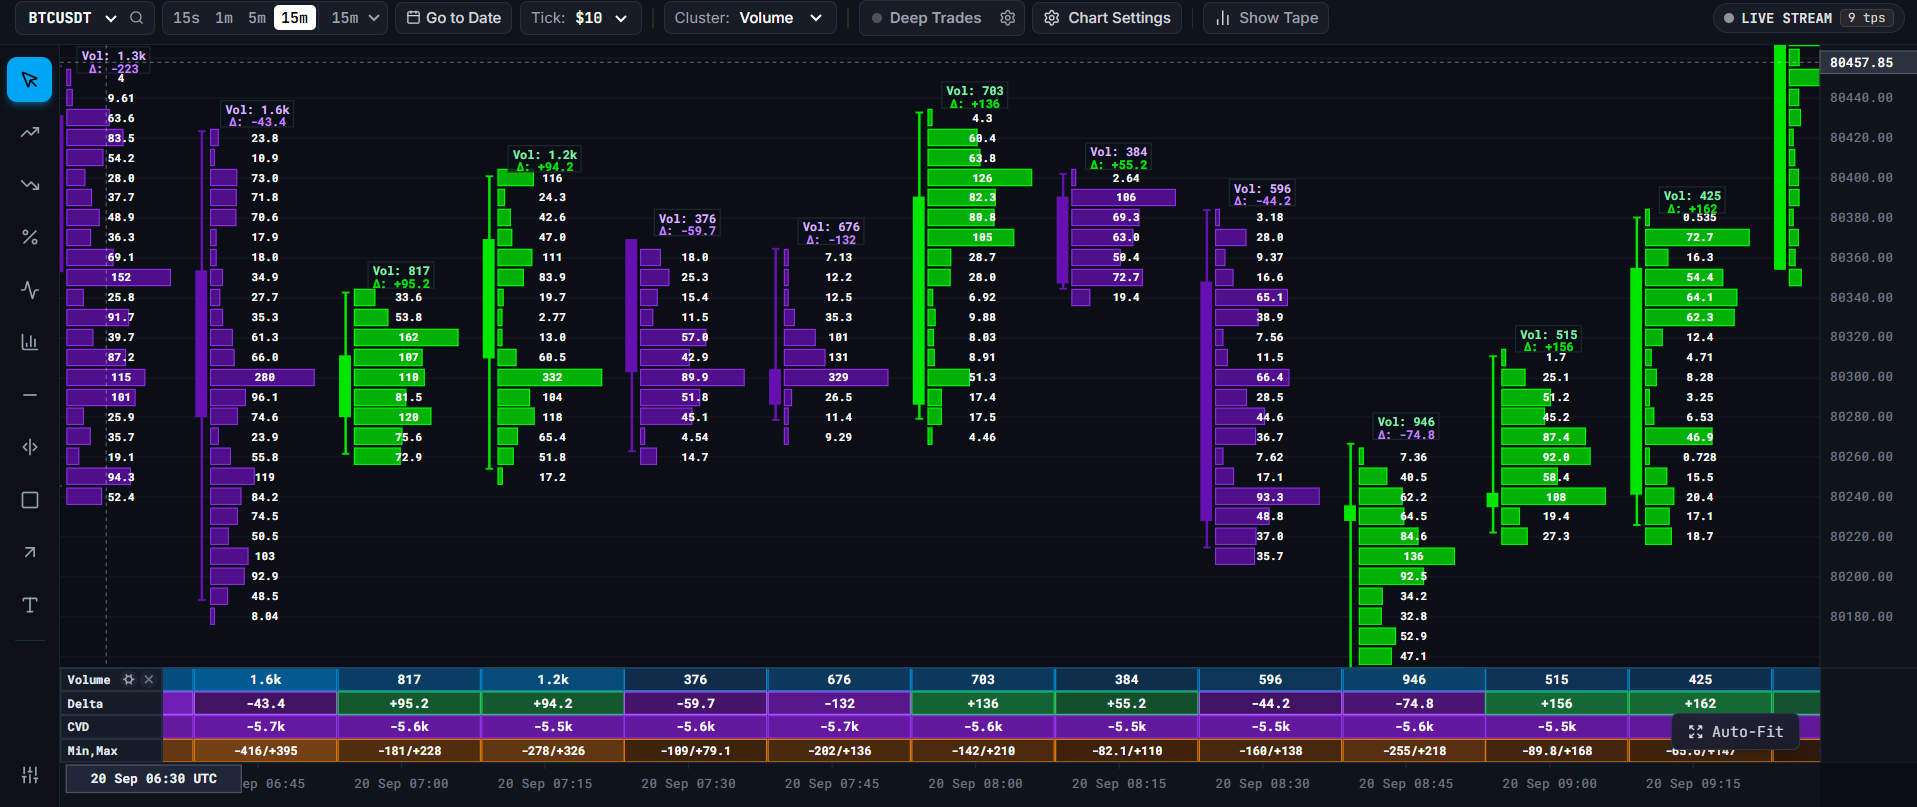
Volume Profile
Precision volume profiles with dynamic POC and Value Area tracking. Find key price levels instantly.
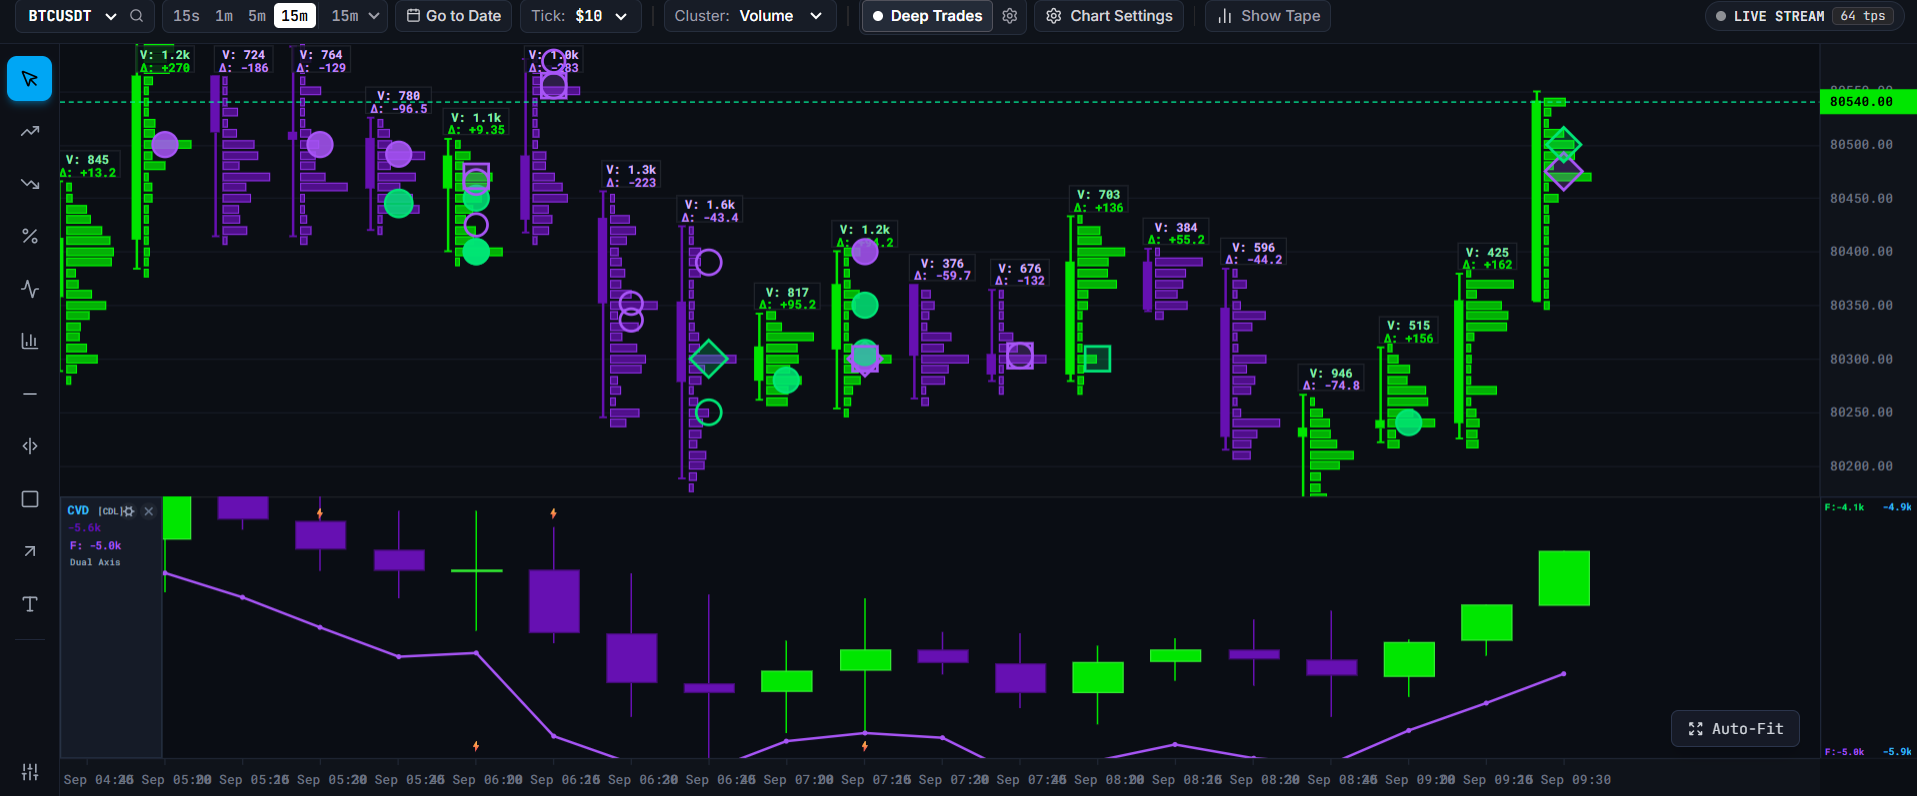
CVD
Cumulative Volume Delta to spot smart money accumulation and distribution. Follow the institutions.
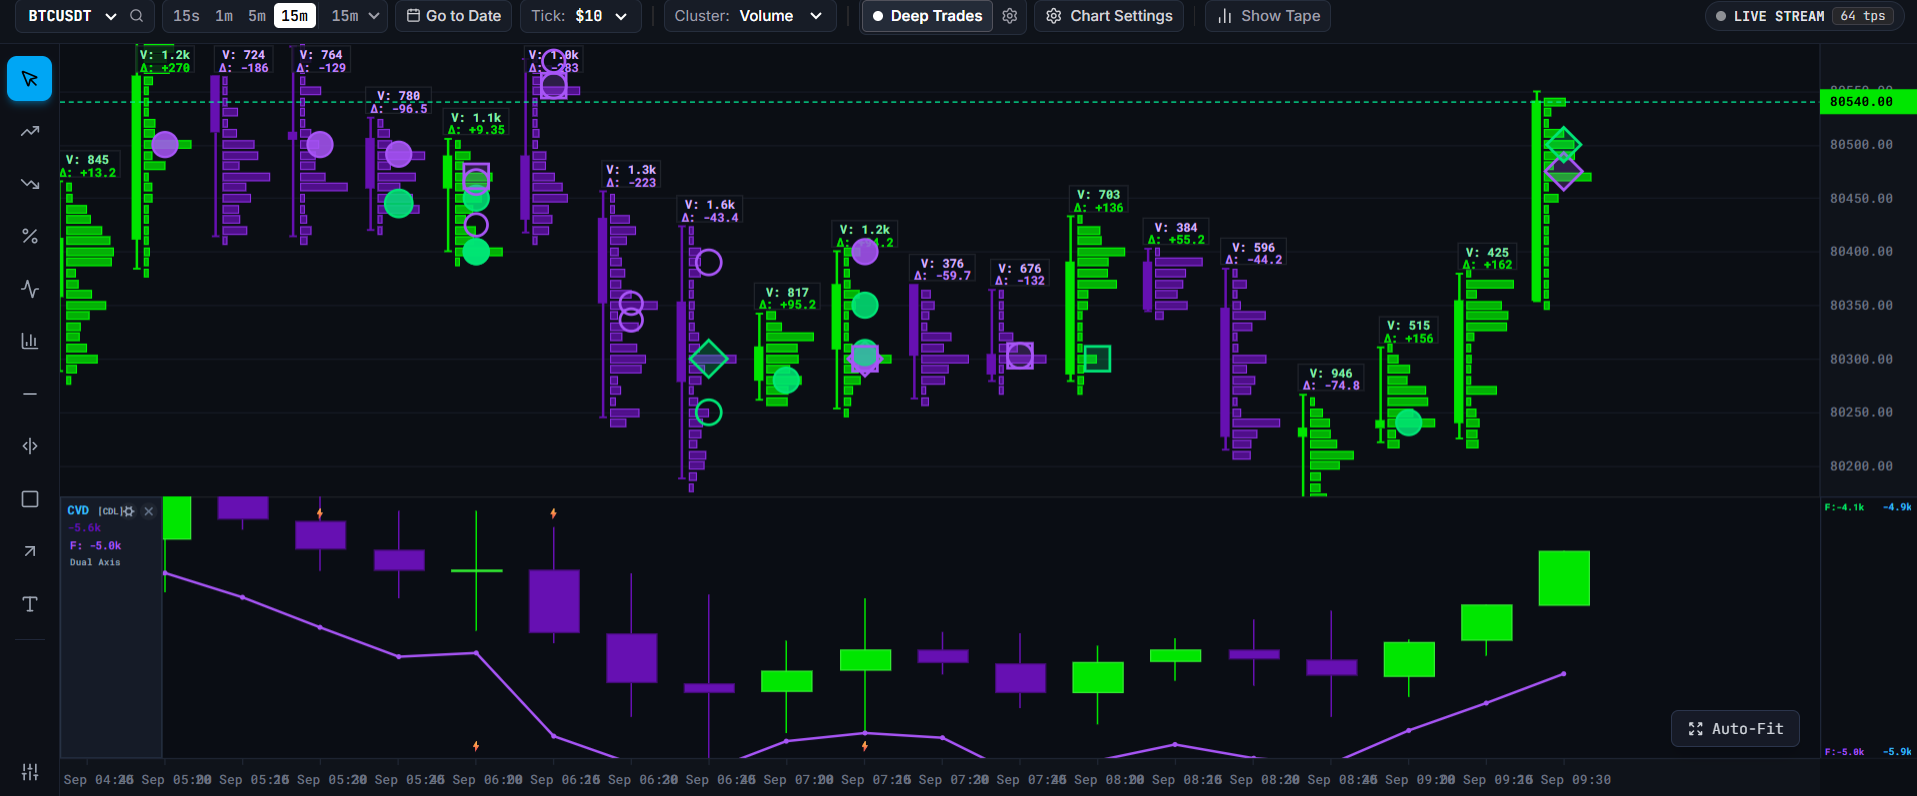
Deep Trades
Every single trade displayed in real-time. Track aggressive buying and selling as it happens.
Footprint Bar Stats
Delta-annotated footprint candles showing bid/ask volume at every price. Full transparency on every bar.
Bid Ask
Real-time bid/ask imbalance visualization. See where buy and sell pressure meets at every price level.
Built for traders who need more than candles.
Ashtriq surfaces the institutional order flow data hidden inside every candle. Footprint columns, delta profiles, CVD, imbalance detection, and whale volume analysis.
Frequently Asked Questions
What is a crypto footprint chart?
A footprint chart is a multi-dimensional candlestick that reveals every executed transaction inside each price level. Instead of merely showing Open, High, Low, and Close, it displays executed bid and ask contracts, letting you see whether buyers or sellers were absorbed by passive limit orders.
How does Cumulative Volume Delta (CVD) assist trading?
CVD measures the net difference between aggressive market buying and aggressive market selling. When price makes a new high but CVD fails to make a new high (CVD divergence), it alerts traders to buying exhaustion and institutional absorption before a trend reversal occurs.
Is Ashtriq free during the public beta?
Yes. You can access live Binance USDⓈ-M Futures footprint charts, CVD sub-panes, Point of Control (POC), and Deep Trades whale markers directly in your browser without entering payment details.
Do I need desktop downloads or API keys?
No software installations or exchange API keys are needed. Ashtriq connects directly to institutional WebSocket streams and high-throughput ClickHouse time-series storage, rendering at 60 FPS in any modern web browser.
Ready to see the full picture?
Join the public beta. No credit card required. Full orderflow access in your browser.